EGOpro MANAGER
EGOpro MANAGER
The importance of analysing data
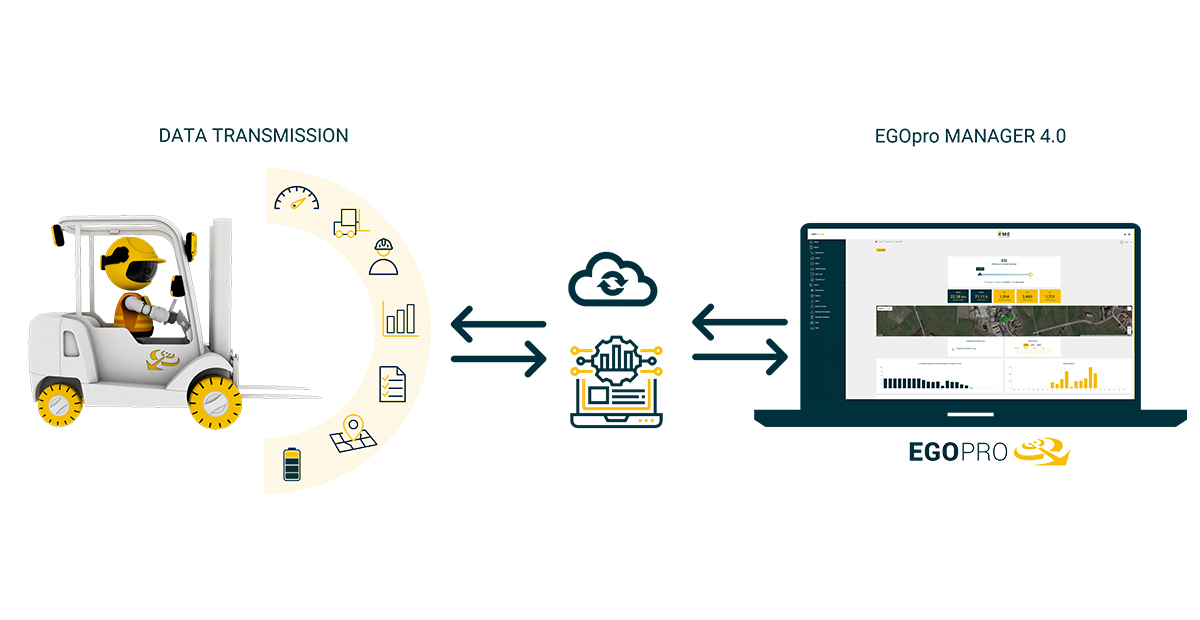
The evolution of the range of products offered by AME is not restricted to just providing a real-time solution, but goes further: by using state-of-the-art technological tools such as artificial intelligence (AI), machine learning and cloud computing, AME processes and analyses the data that sensors installed at the premises collect. By means of this analysis the risk level in the operational zones is assessed, and the best strategy to be implemented specifically for the situation is suggested to create safer and more efficient work zones. Finally, it also offers the chance to check the results after a change is implemented, thereby, starting a virtuous circle that enhances safety.

Dashboard

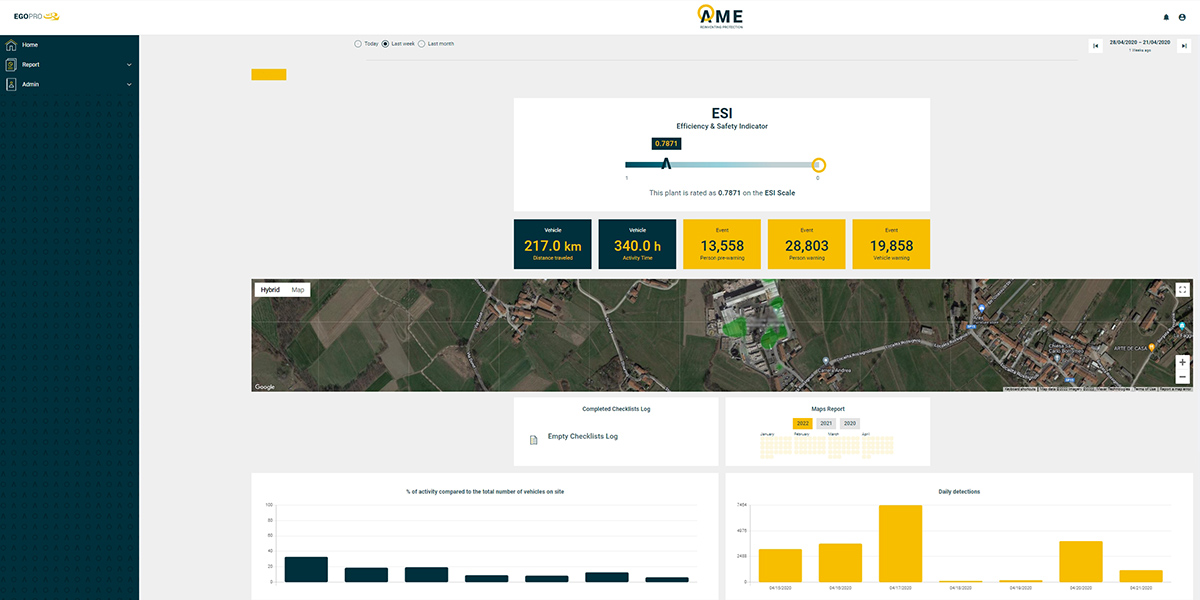
The EGOpro MANAGER 4.0 cloud platform, 100% developed by AME’s Research & Development Team, shows all the data that are continuously captured coming from the environment, vehicles, and the EGOpro Safe MOVE system, in a user-friendly and concise manner through a dynamic and immediate dashboard.
ESI - Efficiency & Safety Indicator

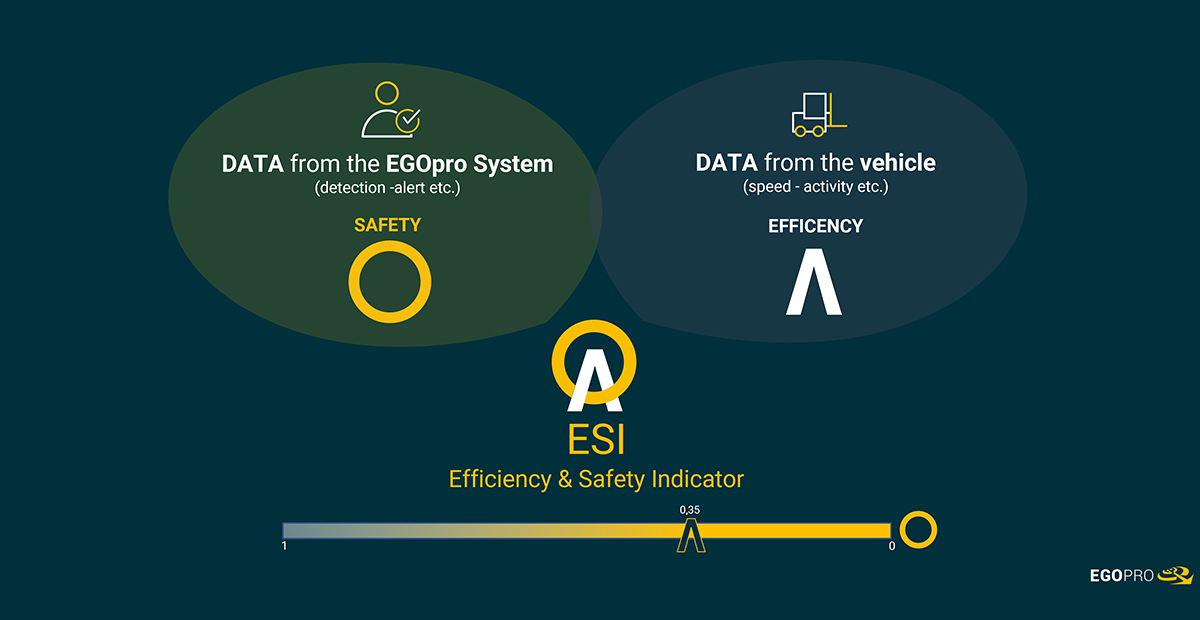
Through predictive analytics based on Big Data, combined with IoT tools and Machine Learning, AME successfully processes the summary of the relation between efficiency and safety in the ESI – Efficiency & Safety Indicator coefficient. This coefficient shows customers, in real-time, the “picture” of the condition of their plant expressed in a simple number.
Cloud Computing
Through collecting and analysing data by means of the most advanced data processing technologies, our web-based software offers:
1.
Data and reporting
Statistical reports on vehicle/pedestrian worker interactions (pre-warning and warning), how many hours vehicles are running, kilometres travelled, etc. You can know:
- The layout of the most dangerous work zones
- Days and times with the most vehicle/pedestrian worker interactions
- The activities that are most susceptible to risk
- The activity status of vehicles
2.
Continuous analysis and improvement
The risks that derive from the continuous data analysis via EGOpro Manager 4.0 are identified and assessed and safety improvement projects balanced with production efficiency are implemented.
These projects may include:
- Modifying procedures
- Scheduling new training courses
- Setting the speed limits in danger zones
- Setting the number of workers in risk zones
3.
Checking results
After a period of monitoring, results can be analysed to measure the effect of the newly implemented activities, assessing whether they are appropriate and effective in preventing events from being repeated, or whether further action is needed. Since a sole number that sums up safety data and efficiency data is displayed, it will be faster, easier and more intuitive to understand the optimisation level that is underway, and comparisons can be made among:
- Different months or weeks
- Vehicles that carry out different activities
- Plants belonging to the same Group